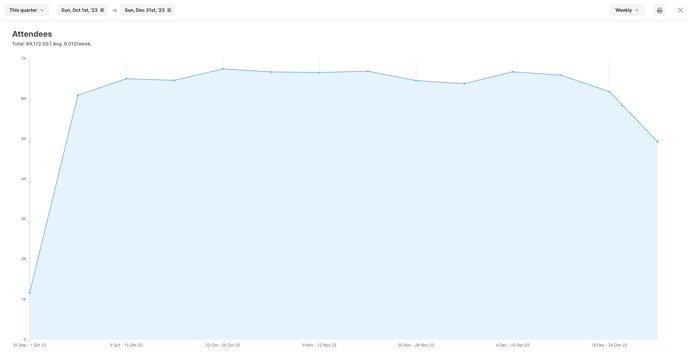
With Graph Mode, understanding your space usage has never been more accessible. Gain valuable insights, make data-driven decisions, and optimise the utilisation of your spaces effectively.
Graph Mode offers various data sets to cater to your specific needs. The following are some of the key metrics broken down for your convenience:
- Revenue: Track the financial performance of your spaces.
- Attendees: Monitor the number of attendees in your spaces.
- Number of Bookings: Keep tabs on the frequency of bookings.
- Average Revenue: Evaluate the average financial return per booking.
- Average Attendees: Determine the average number of attendees per booking.
Accessing Graph Mode
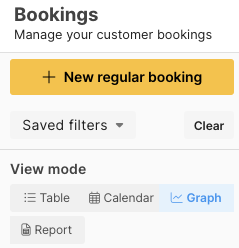 To use Graph Mode, navigate to the Bookings menu at https://app-demo.spaceto.co/dashboard/host/bookings.
In the filters column to the right of the main menu, you'll see 'View Mode.' Click on "Graph” to enter Graph Mode.
Using Filters
Thanks to the booking filters, the data represented by the graphs can be modified. See this article for more information on booking filters.
You can filter using atrtibutes like booking notes, tags, discounts, or booking types.
Example: I need to understand all casual bookings for the meeting room this financial year, OR, I need to understand how much our playing fields have been used this month.
Adjusting the Date Range
Tailor your analysis by selecting the desired date range. Choose a custom start and end date or any one of the helpful date range presets, allowing you to instantly access a visual overview of your data.
Expanding Graphs for Better Visibility & Printing
Enhance your data visualisation by expanding graphs by clicking the expand arrow at the top right corner of the graph. From here you can:
- Print the individual graph
- Adjust the date range
Watch in Action
To see these features in action, check out our video tutorial here.